In a large number of IoT projects, the devices are usually scattered over a large area or in a building. A map view of one’s own devices with their positioning is therefore a welcome feature for many users. Most of the map widgets provided are based on online maps and GPS coordinates. However, many of the IoT devices do not have their own GPS sensor, are not accurate enough or should be displayed on an individual map view.
The Drag’n’Drop Map Widget, designed for the Cumulocity IoT Cloud Platform, is a simple map view with drag-and-drop functionality to position your IoT devices accordingly.
Usage - How does the widget work?
When using the widget, it is assumed that the IoT devices of interest are registered in the cloud. For administrative management, it is usually common to create some group structure and assign the IoT devices and sensors to these groups.
Example: Grouping Devices by locations
A company has different locations around the world. One possible group structure could be to divide its devices by country and by each of the company’s locations and define which devices are used at which location.
Once such an assignment of groups has been made, the next step is to use our Building Map widget. All you need to do is have an image file of your property or building outline ready and upload it to the IoT platform.
 Figure 1: Upload map picture
After the image file has been successfully uploaded, now comes the fun part 😁
The individual placement of the sensors!
The sensors assigned to the group are displayed on the map and can be moved by mouse click. Once you are satisfied with the placement of the sensors, the setting is saved by locking the dashboard (🔐 top right).
 Figure 2: Placement of sensor-icons with drag and drop functionality
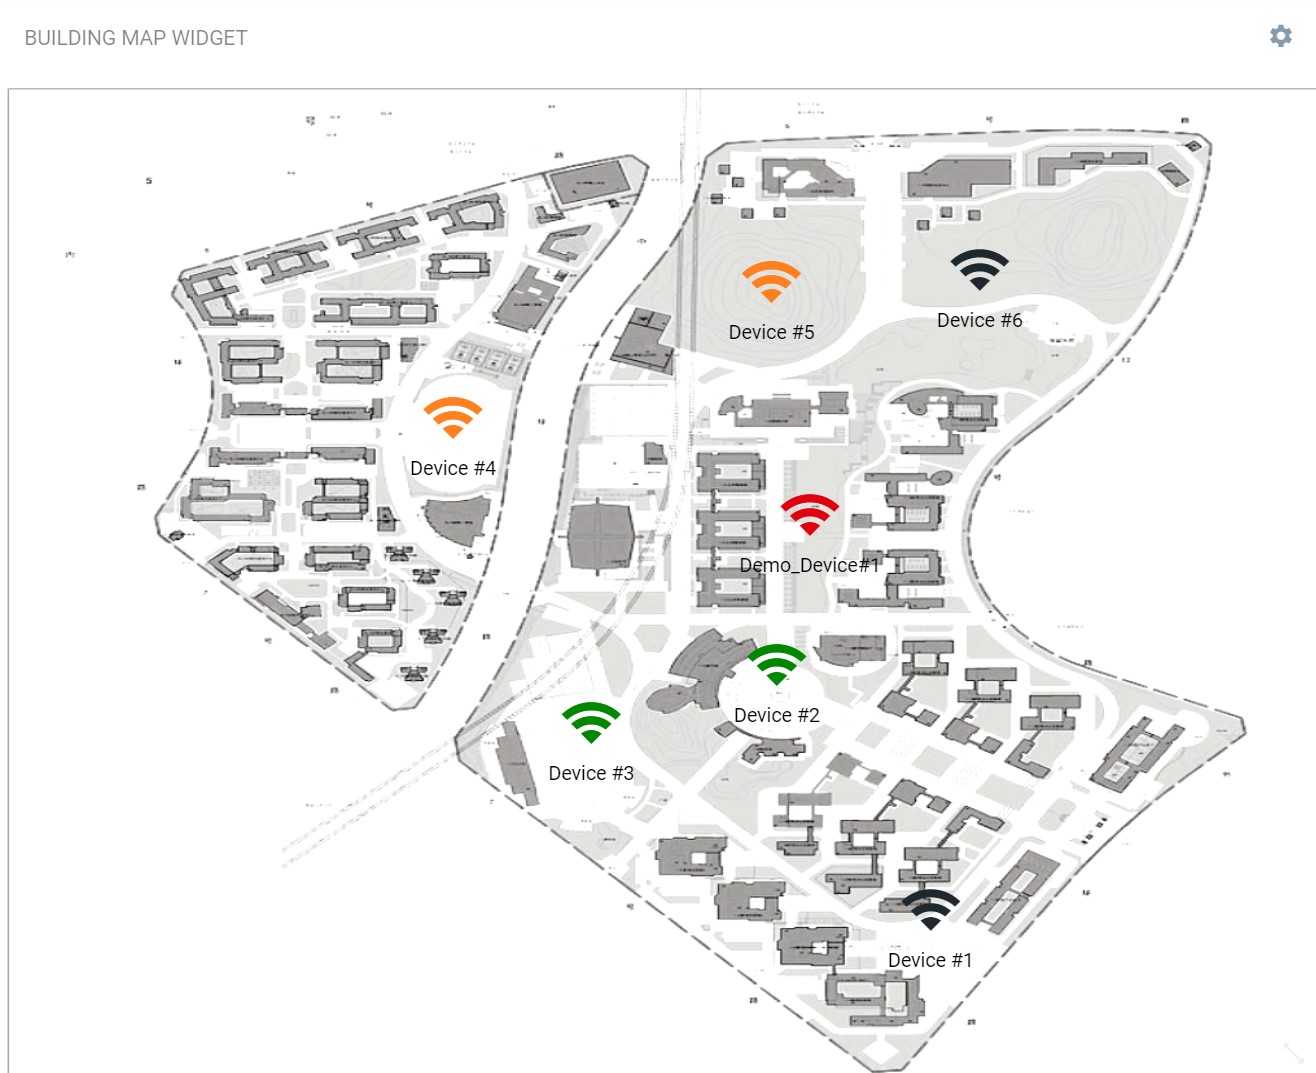
That’s it!🎉 The widget is now individually configured and displays the current status of the sensors within a group in real time. By using traffic light colours🚦the viewer immediately sees which sensors are sounding an alarm and where the sensors are located on the property. If a sensor is currently deactivated or has not sent any data to the platform for a predefined time, the sensor icon is shown in grey.
If the user wants to know more details about the sensor in question, simply click on the relevant sensor and the dashboard view for the sensor will be displayed. Here the user has the possibility to view and evaluate all sensor readings and statuses in the history.
As soon as the alarms have been confirmed and the sensor switches to the normal state, the sensor icons in the Building Map widget switch back to the colour green.🟢
 Figure 3: Real-time alerting through colour change and direct linking to the sensor objects
Technical aspects for Developers
The main feature of this widget is the simplicity of its use. The individual positioning of sensors on a map using drag-and-drop is an essential part of the widget. To implement such functionality with Angular, I use the DragDropModule.
To create my movable sensor icons, the cdkDrag class must be assigned to the objects.
To ensure that the sensors can only be moved within the widget, a CSS class is linked to the cdkDragBoundary. The initial position of the sensor is defined in [cdkDragFreeDragPosition]. When the widget is used for the first time, the sensor is centred on the widget. Otherwise, the last position where the sensor was last moved is called. Each new movement of a sensor is tracked with (cdkDragEnded). In [cdkDragDisabled] it is dynamically determined when the functionality for drag-and-drop is activated.
<!-- List of sensor child assets -->
<div  *ngFor="let child of childAssets; let i = index" >
    <!-- Load sensor with cdkDrag and update positions -->
    <a #icon
        class="icon"
        cdkDrag
        cdkDragBoundary=".overlay"
        [cdkDragFreeDragPosition]="dragPositions.get(child.id)"
        [cdkDragDisabled]="isFrozen"
        (cdkDragEnded)="drop($event,child)">
            <!-- Change color for different status -->
            <i class="dlt-c8y-icon-wifi"
                [ngStyle]="{color: childIsUnavailable[i] ? '#1e292f' : childIsCritical[i] ? '#E0000E' : childIsMajor[i] ? '#FF801F' : '#008800'}"></i>
            <!-- Display sensor name -->
            <p class="crop">{{child.name}}</p>
    </a>
</div>
Code 1: HTML for displaying the sensors and integrating cdkDrag
Let’s take a closer look at the method call drop($event,child). To guarantee that the positions of the sensors on the map remain the same even with different screen resolutions, a conversion is necessary.
The class cdkDrag only provides the absolute (x, y) position of the sensor in relation to the widget. The relative position must therefore also be determined in order to guarantee exact positioning on the map with different screen resolutions.
// Update Position of every sensor after drag and drop
function drop(event:any, device:IManagedObject){
    const newPos = event.source.getFreeDragPosition(); // get new position
    this.dragPositions.set(device.id, newPos); // update new position of sensor with id

    // Get size of map widget
    this.max_height = this.widget.nativeElement.offsetHeight;
    this.max_width = this.widget.nativeElement.offsetWidth;
    // Calculate relative position of sensor and update in c8y inventory storage
    this.updateChildAssetRelativePosition(device.id);
}
Code 2: Method call with each change of position of a sensor
After the absolute position and the current size of the widget have been determined, the relative position is calculated in updateChildAssetRelativePosition and saved in the platform. If the widget is loaded in the browser, the relative position is always used first and the absolute position is then determined based on this.
// Function to calculate relative position of sensor
function updateChildAssetRelativePosition(id:string){
    // Get absolute position from cdkDrag
    const absPos :any = this.dragPositions.get(id);

    // Calculate relative position using size of widget (max width and height)
    const newPos = {
        x: (absPos.x ) / (this.max_width / 100.0),
        y: (absPos.y ) / (this.max_height / 100.0)
    };
    //  Update relative position in c8y inventory storage
    this.asset.c8y_DevicesImagePositions.set(id, newPos);
}
Code 3: Conversion of absolute position (in pixels) to relative position (in %)
Get the Drag’n’Drop Widget!
If you are interested in using the Drag’n’Drop Map Widget, just contact us at info@nola-ventures.com.
Or check-out NOW a demo version of the widget! Go to our GitHub repo to download the application and install it on your Cumulocity IoT tenant.
 Figure 4: Cumulocity Drag’n’Drop Map Widget Demo repository
Happy drag’n’drop 😊